Vision – Growth Marketing Dashboard
Jan 2026
A comprehensive growth marketing dashboard that provides actionable insights and automation capabilities to drive business expansion.
My Contribution
- UI/UX Design
- Design System
- Interactive Prototyping
- Frontend Development
Tools Used
- Figma
- Framer
- Prototyping tools
- Adobe Creative Cloud

Vision
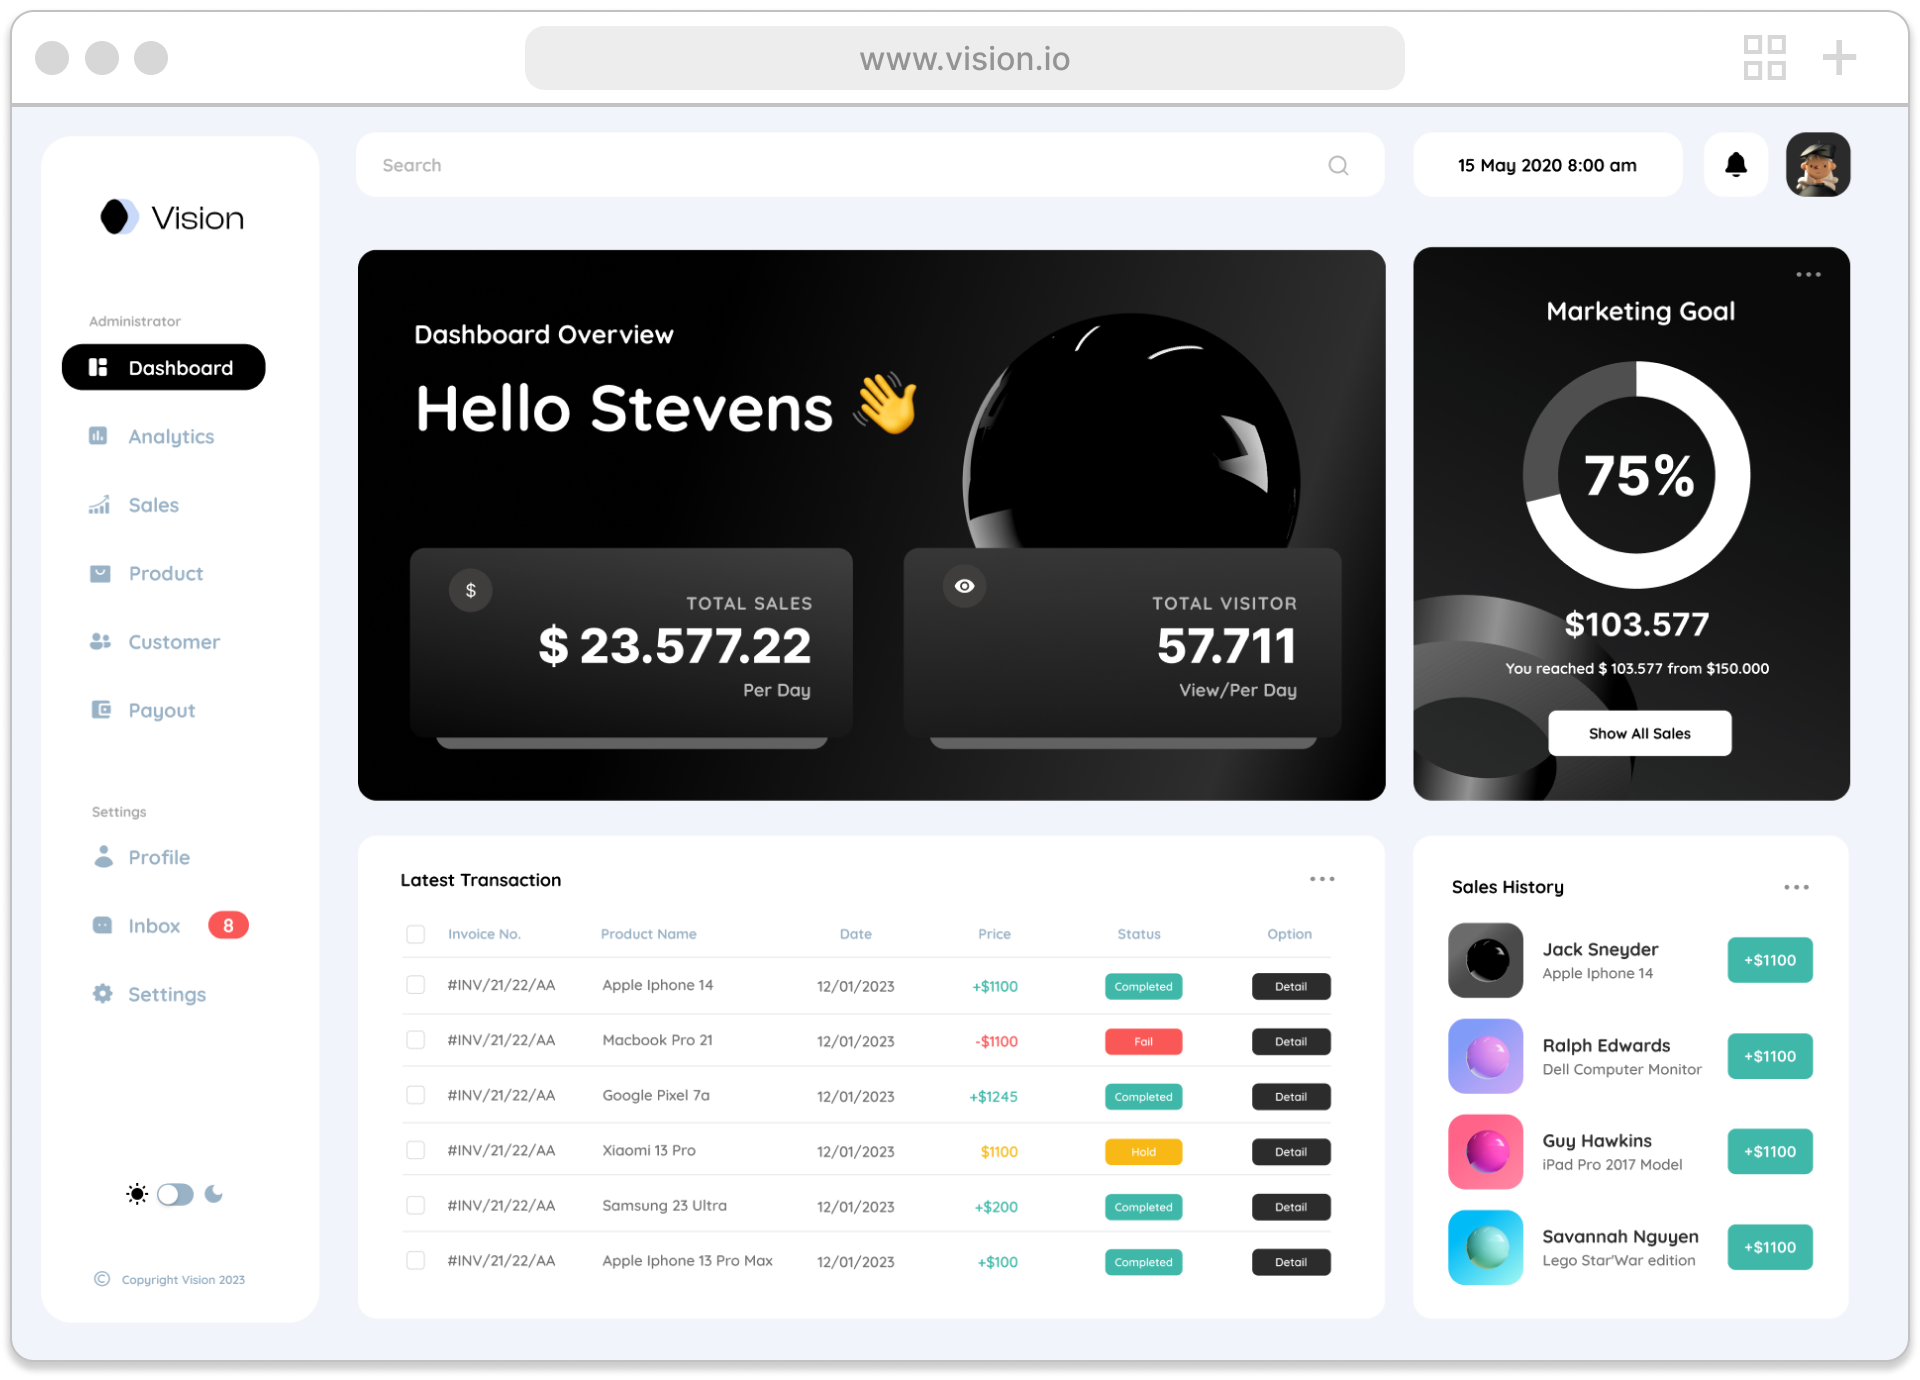
Vision aims to transform complex marketing data into a clear and actionable decision-making system. The platform empowers teams to monitor performance, uncover insights, and optimize campaigns faster with confidence.
By combining real-time analytics with an intuitive dashboard experience, Vision enables marketers to move from data overload to strategic clarity driving smarter growth and measurable impact.
Problem
Marketing teams struggle to make fast and effective decisions due to fragmented data and lack of clear performance visibility across channels.
Data scattered across multiple platforms with no unified view
Difficulty interpreting complex metrics and performance signals
Slow decision-making due to manual analysis and reporting
Limited visibility into actionable insights for optimizing campaigns
“We have a lot of data, but it’s hard to know what actually matters and what to do next.”
Key Insight
- The problem isn’t the lack of data
- It’s the lack of clarity and actionable insights
Opportunity
Transform fragmented marketing data into a clear, actionable decision system that enables teams to move faster and optimize performance with confidence.
- Unifying data across channels into a single source of truth
- Simplifying complex metrics into clear, actionable insights
- Enabling faster decision-making through real-time visibility
- Driving continuous growth through performance optimization
Research & Insights
We conducted user interviews and behavioral analysis with marketing teams to understand how they interact with data and make campaign decisions.
User Types
- Data-overwhelmed marketers who struggle to interpret performance metrics
- Growth-focused users seeking faster, actionable insights
- Advanced users who rely on data to optimize campaigns at scale
Key Insights
- Users have access to data, but lack clarity on what actions to take
- Decision-making slows down due to fragmented tools and manual analysis
- Clear recommendations increase confidence and speed
- Too many metrics → cognitive overload → inaction
Clarity drives action — not the volume of data.
Solution
Based on user needs and decision-making behavior, we designed a centralized growth dashboard that transforms complex marketing data into clear, actionable insights.
- Aggregate data from multiple channels into a unified dashboard
- Analyze performance metrics in real-time
- Highlight key insights and trends automatically
- Provide actionable recommendations to optimize campaigns
Design Approach
We translated user insights into a design approach that transforms complex data into clear, actionable decisions while supporting scalable growth.
Clarity
Simplified complex metrics into clear, decision-ready insights.
Focus
Reduced cognitive load through focused and prioritized data views.
Scalability
Designed a modular system to support growing data complexity.
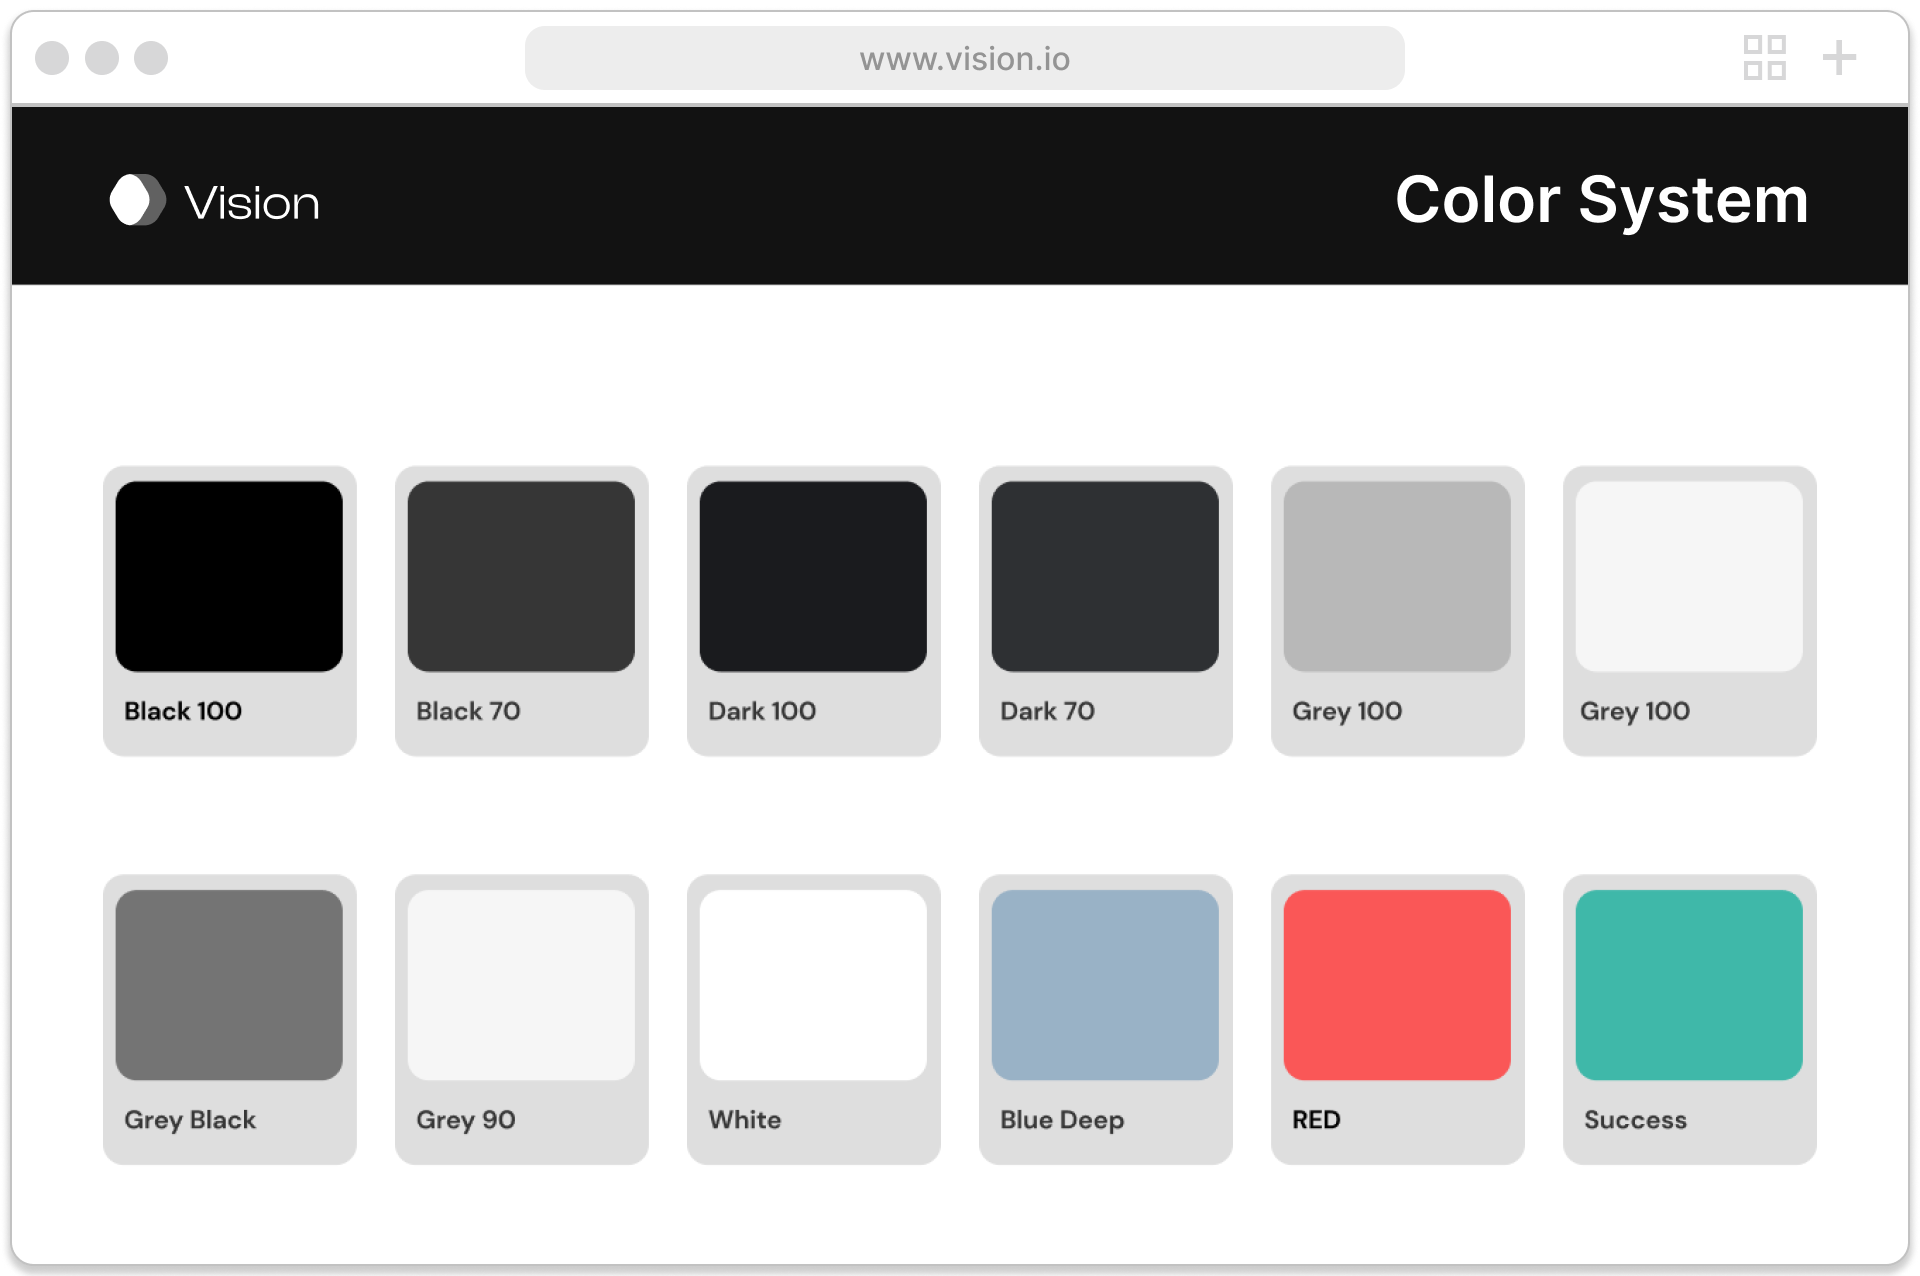
Design System
We built a scalable design system to ensure consistency across complex data interfaces, enabling faster iteration and seamless collaboration between design and engineering.
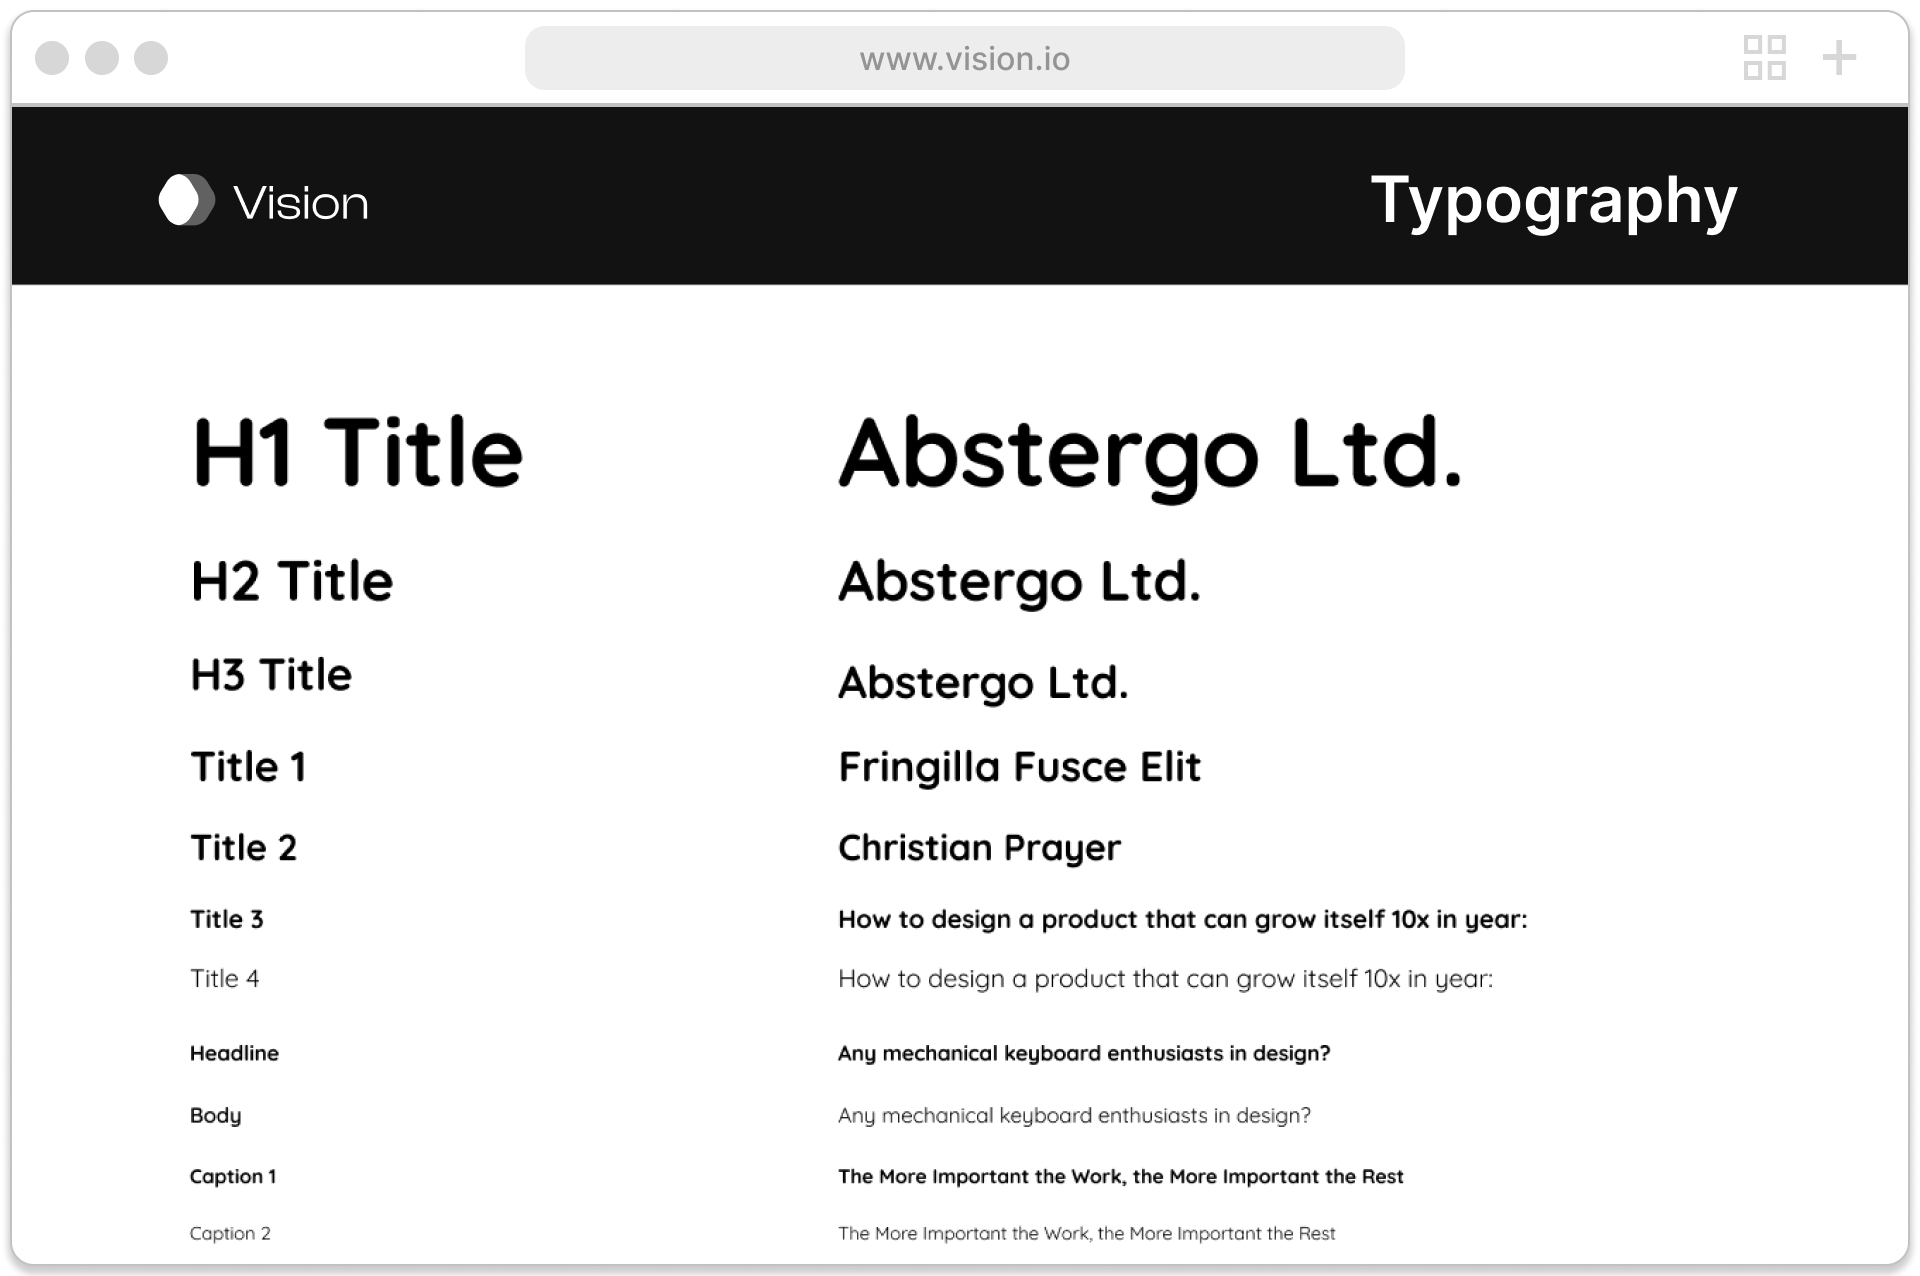
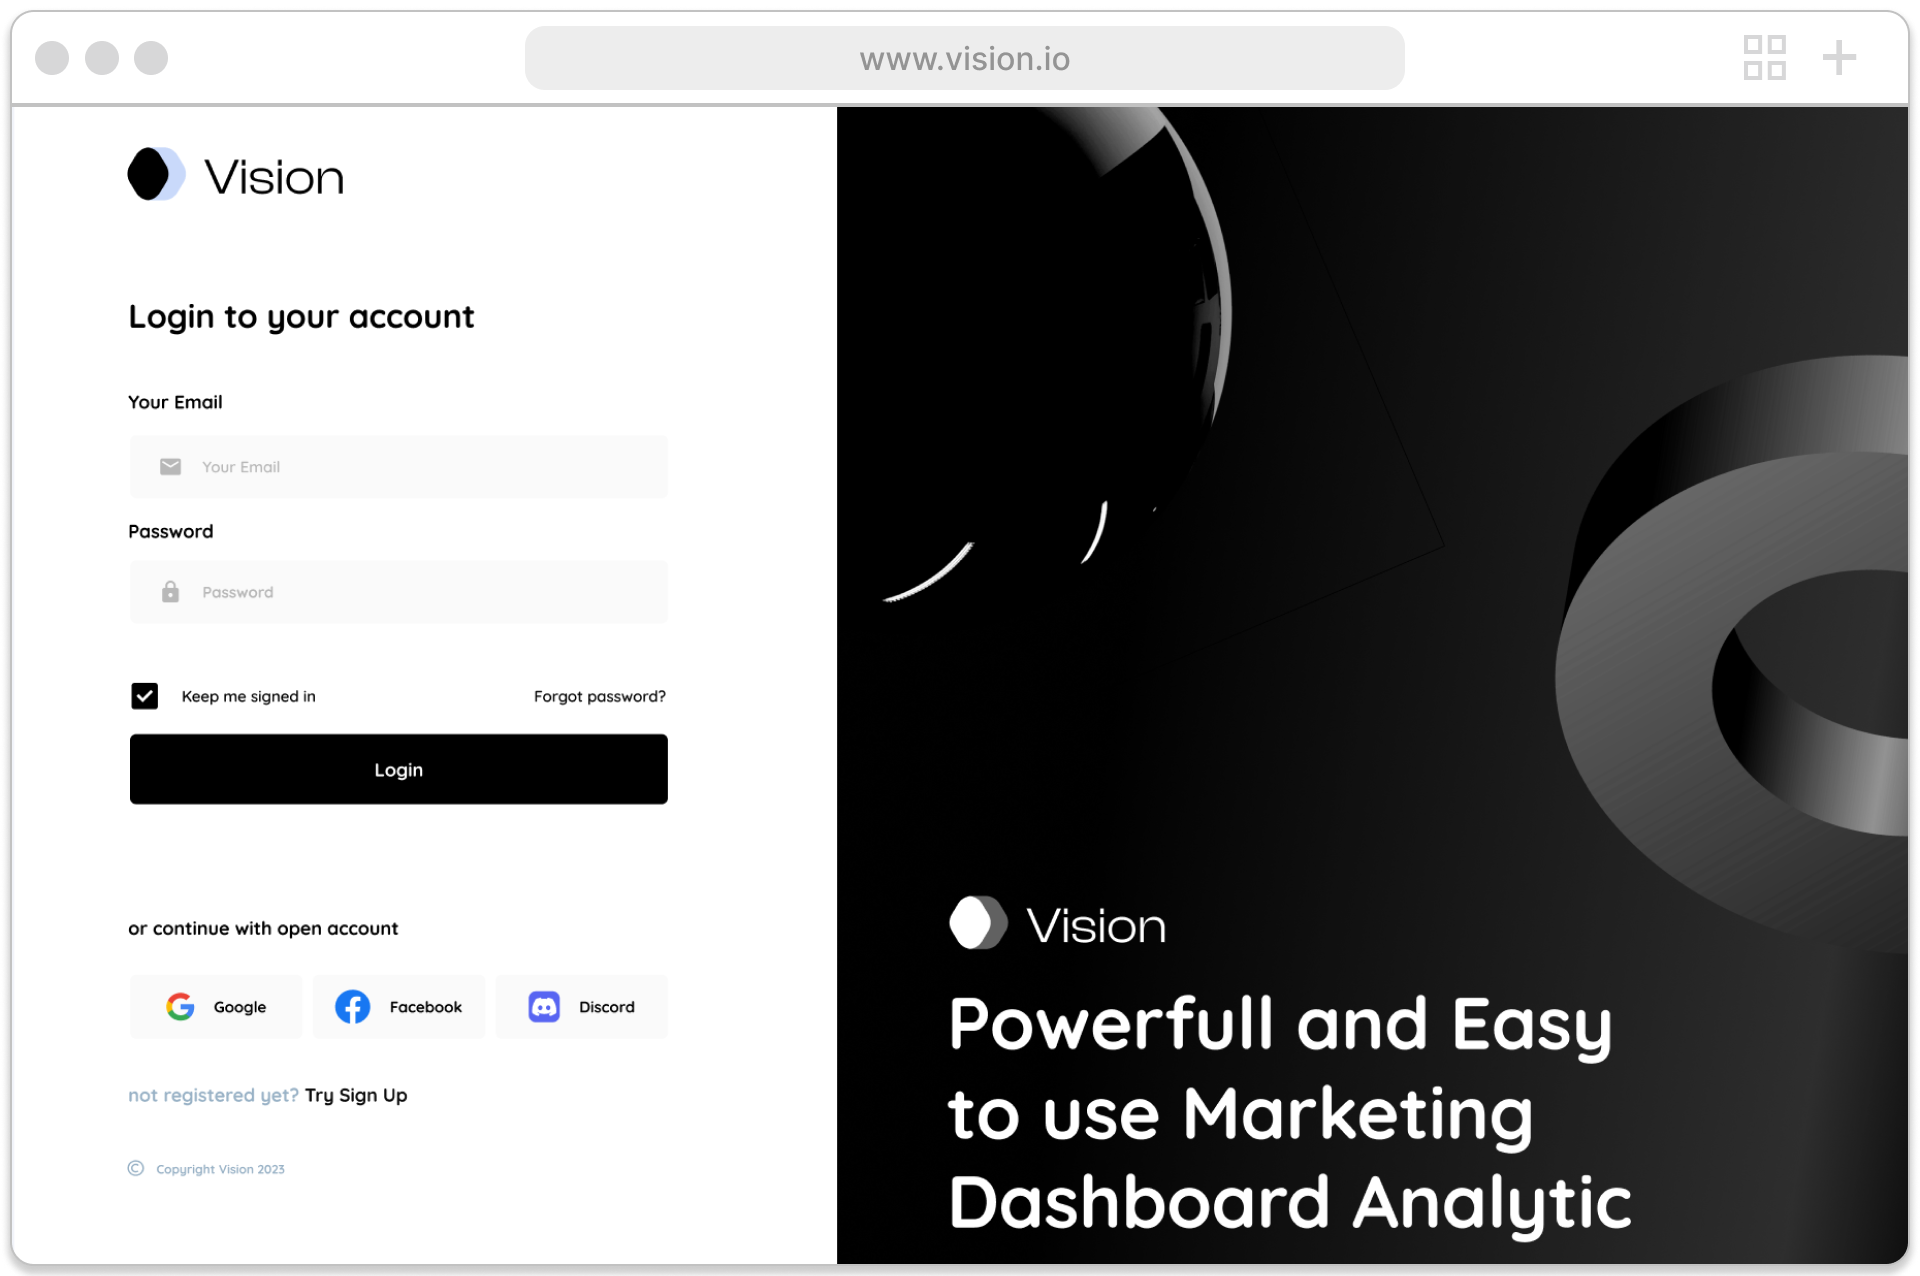
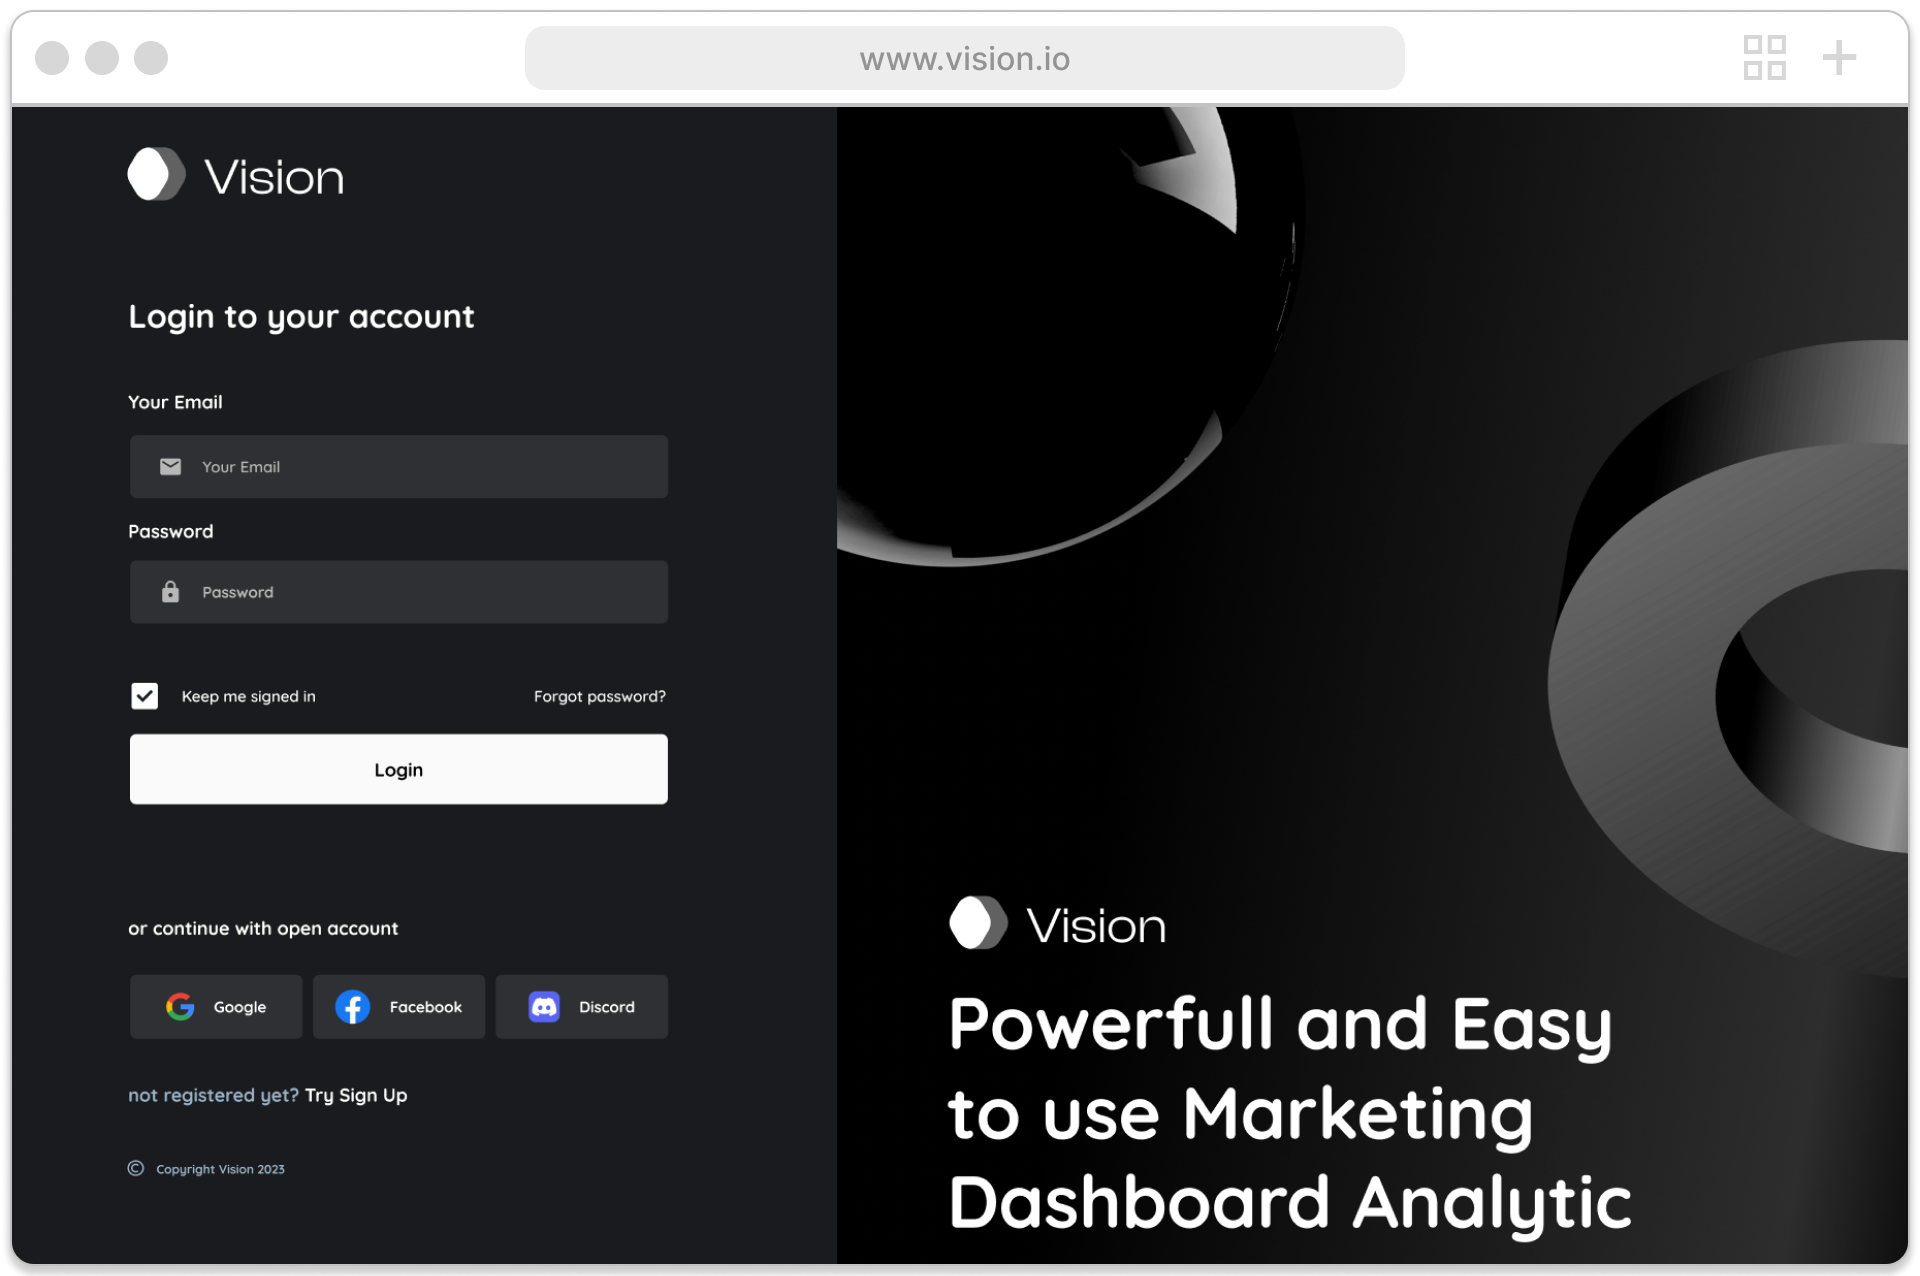
Designing
Focused on delivering a clear, accessible, and adaptable experience across different environments.
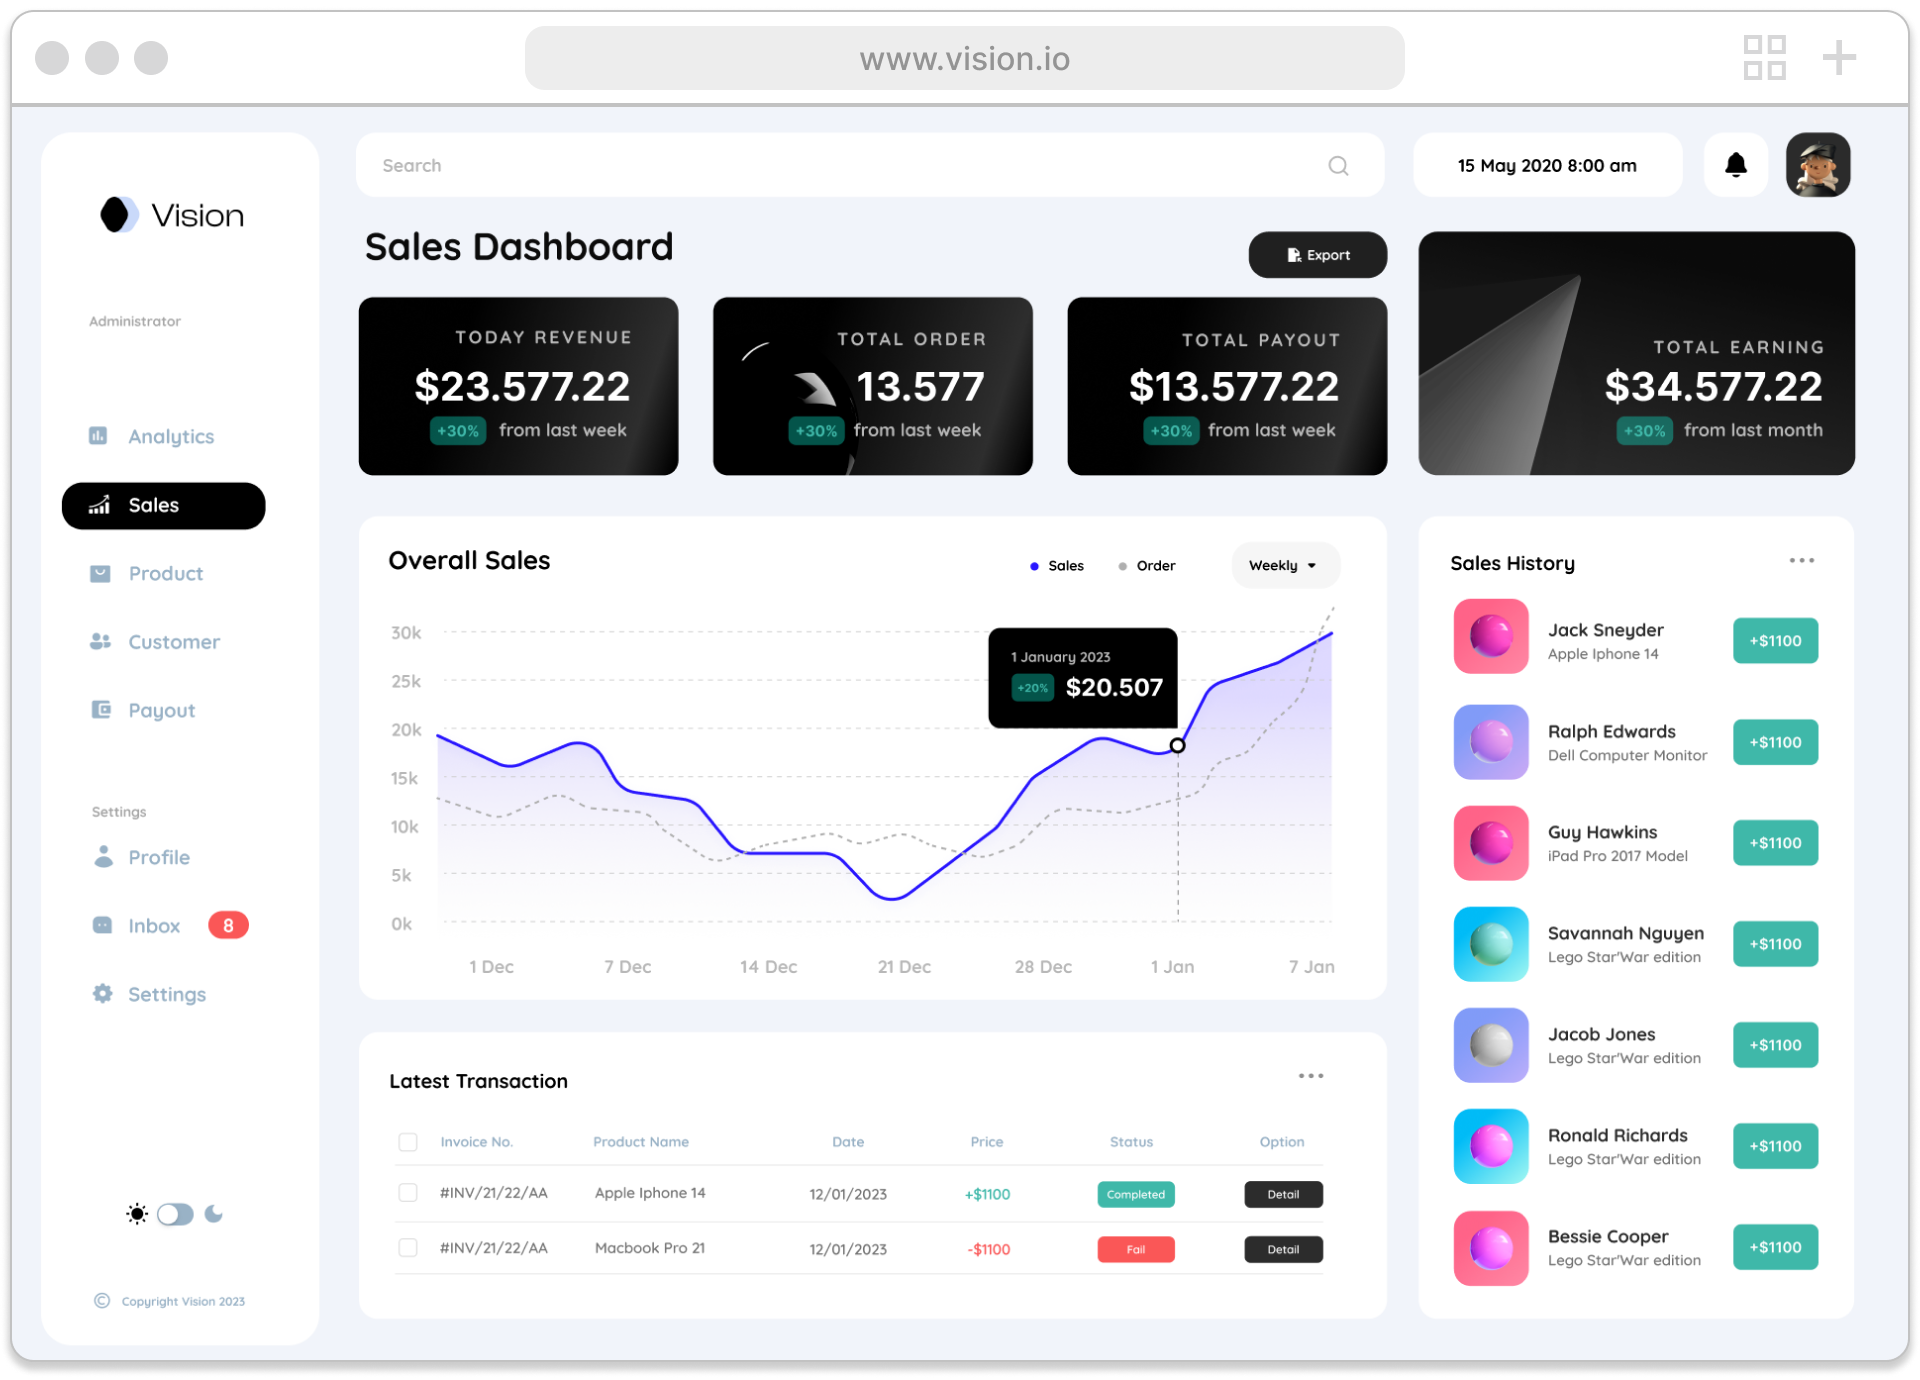
Light Mode
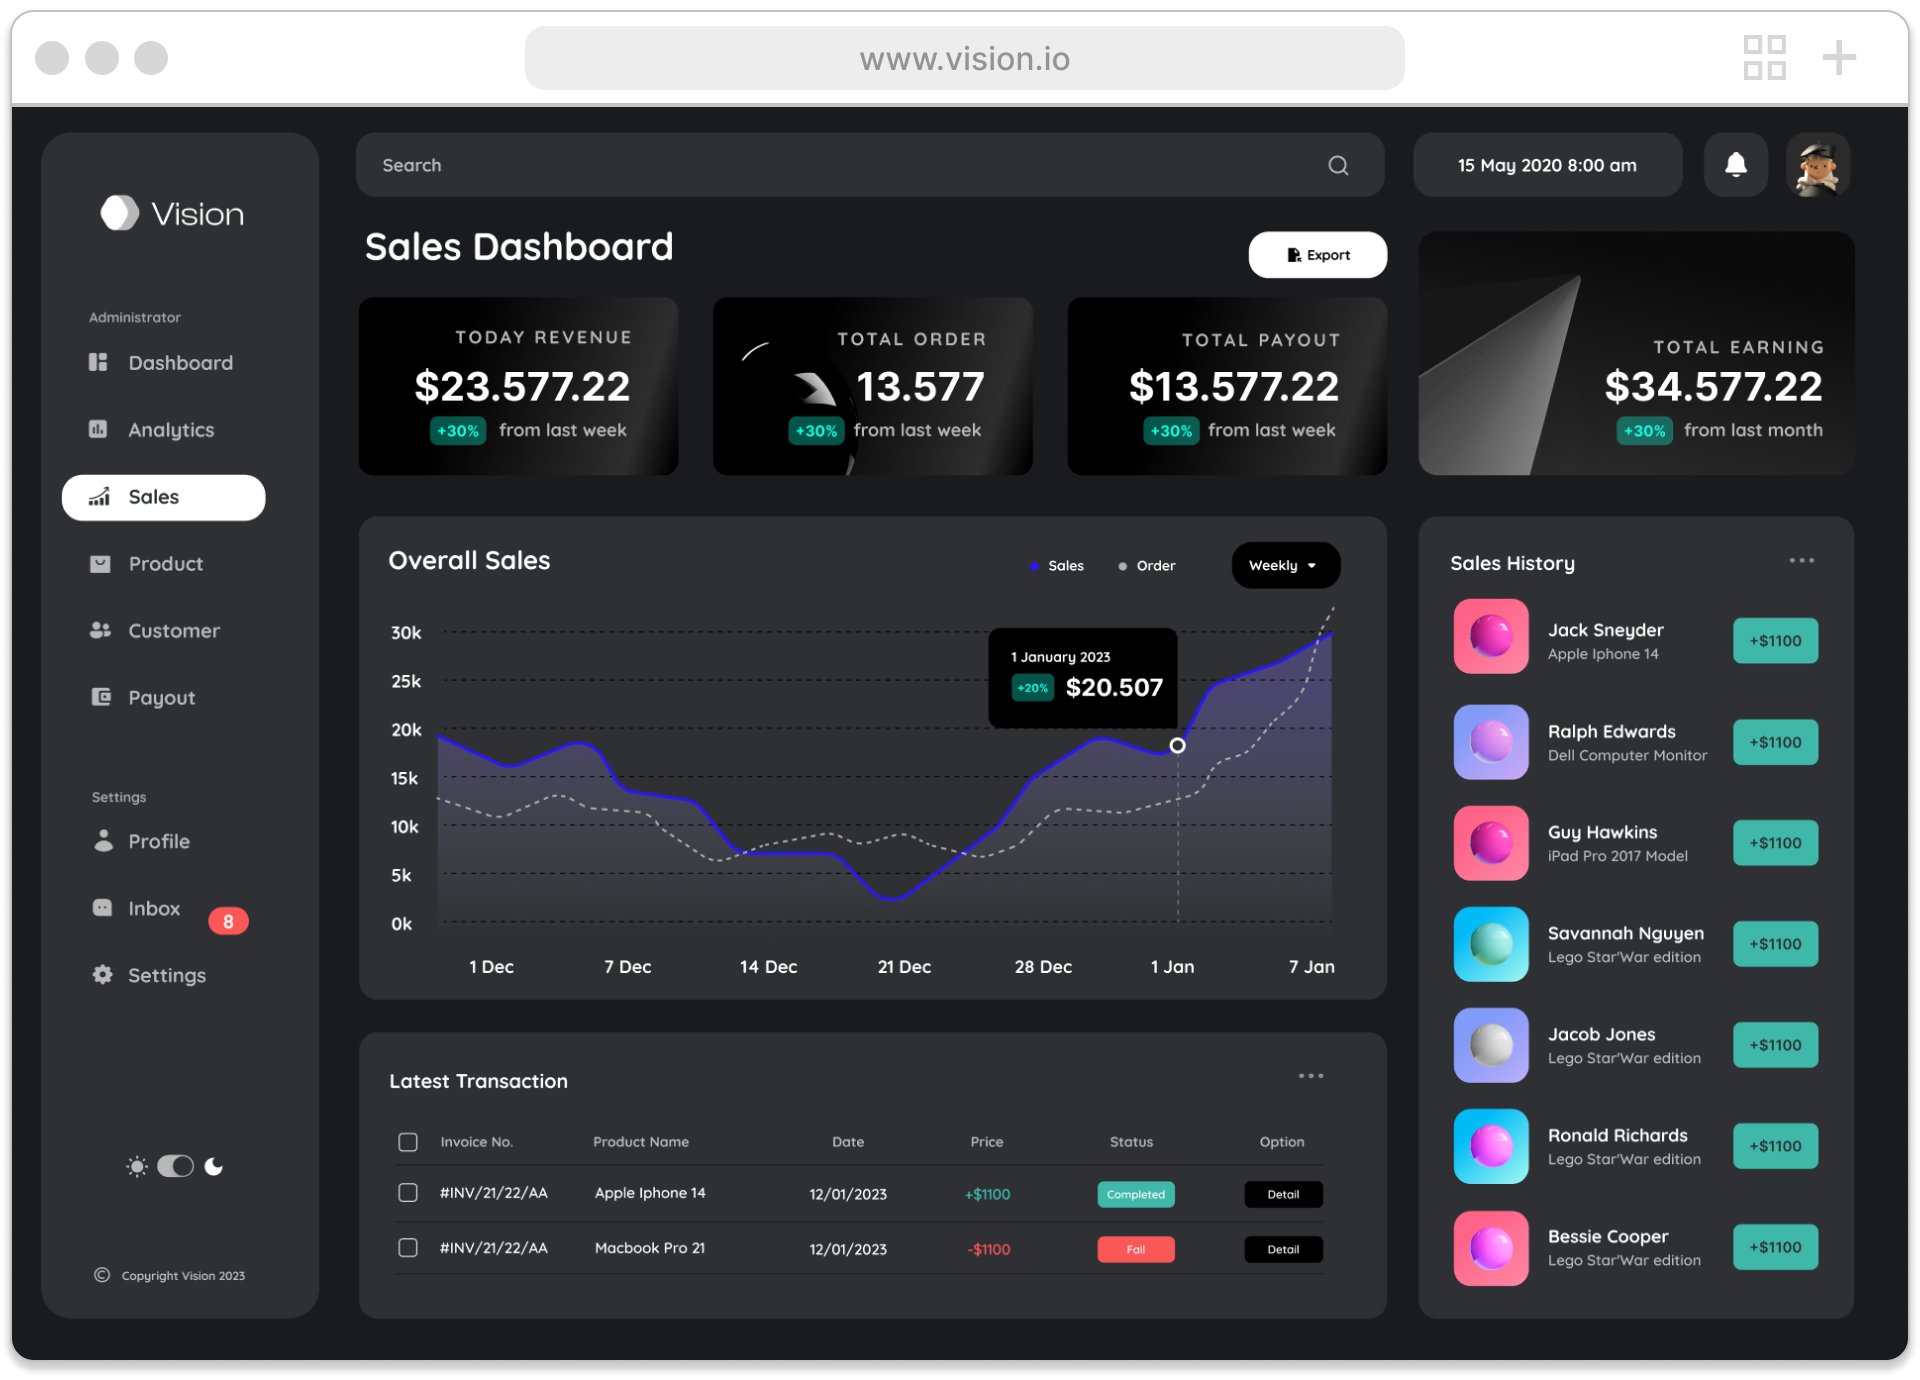
Dark Mode
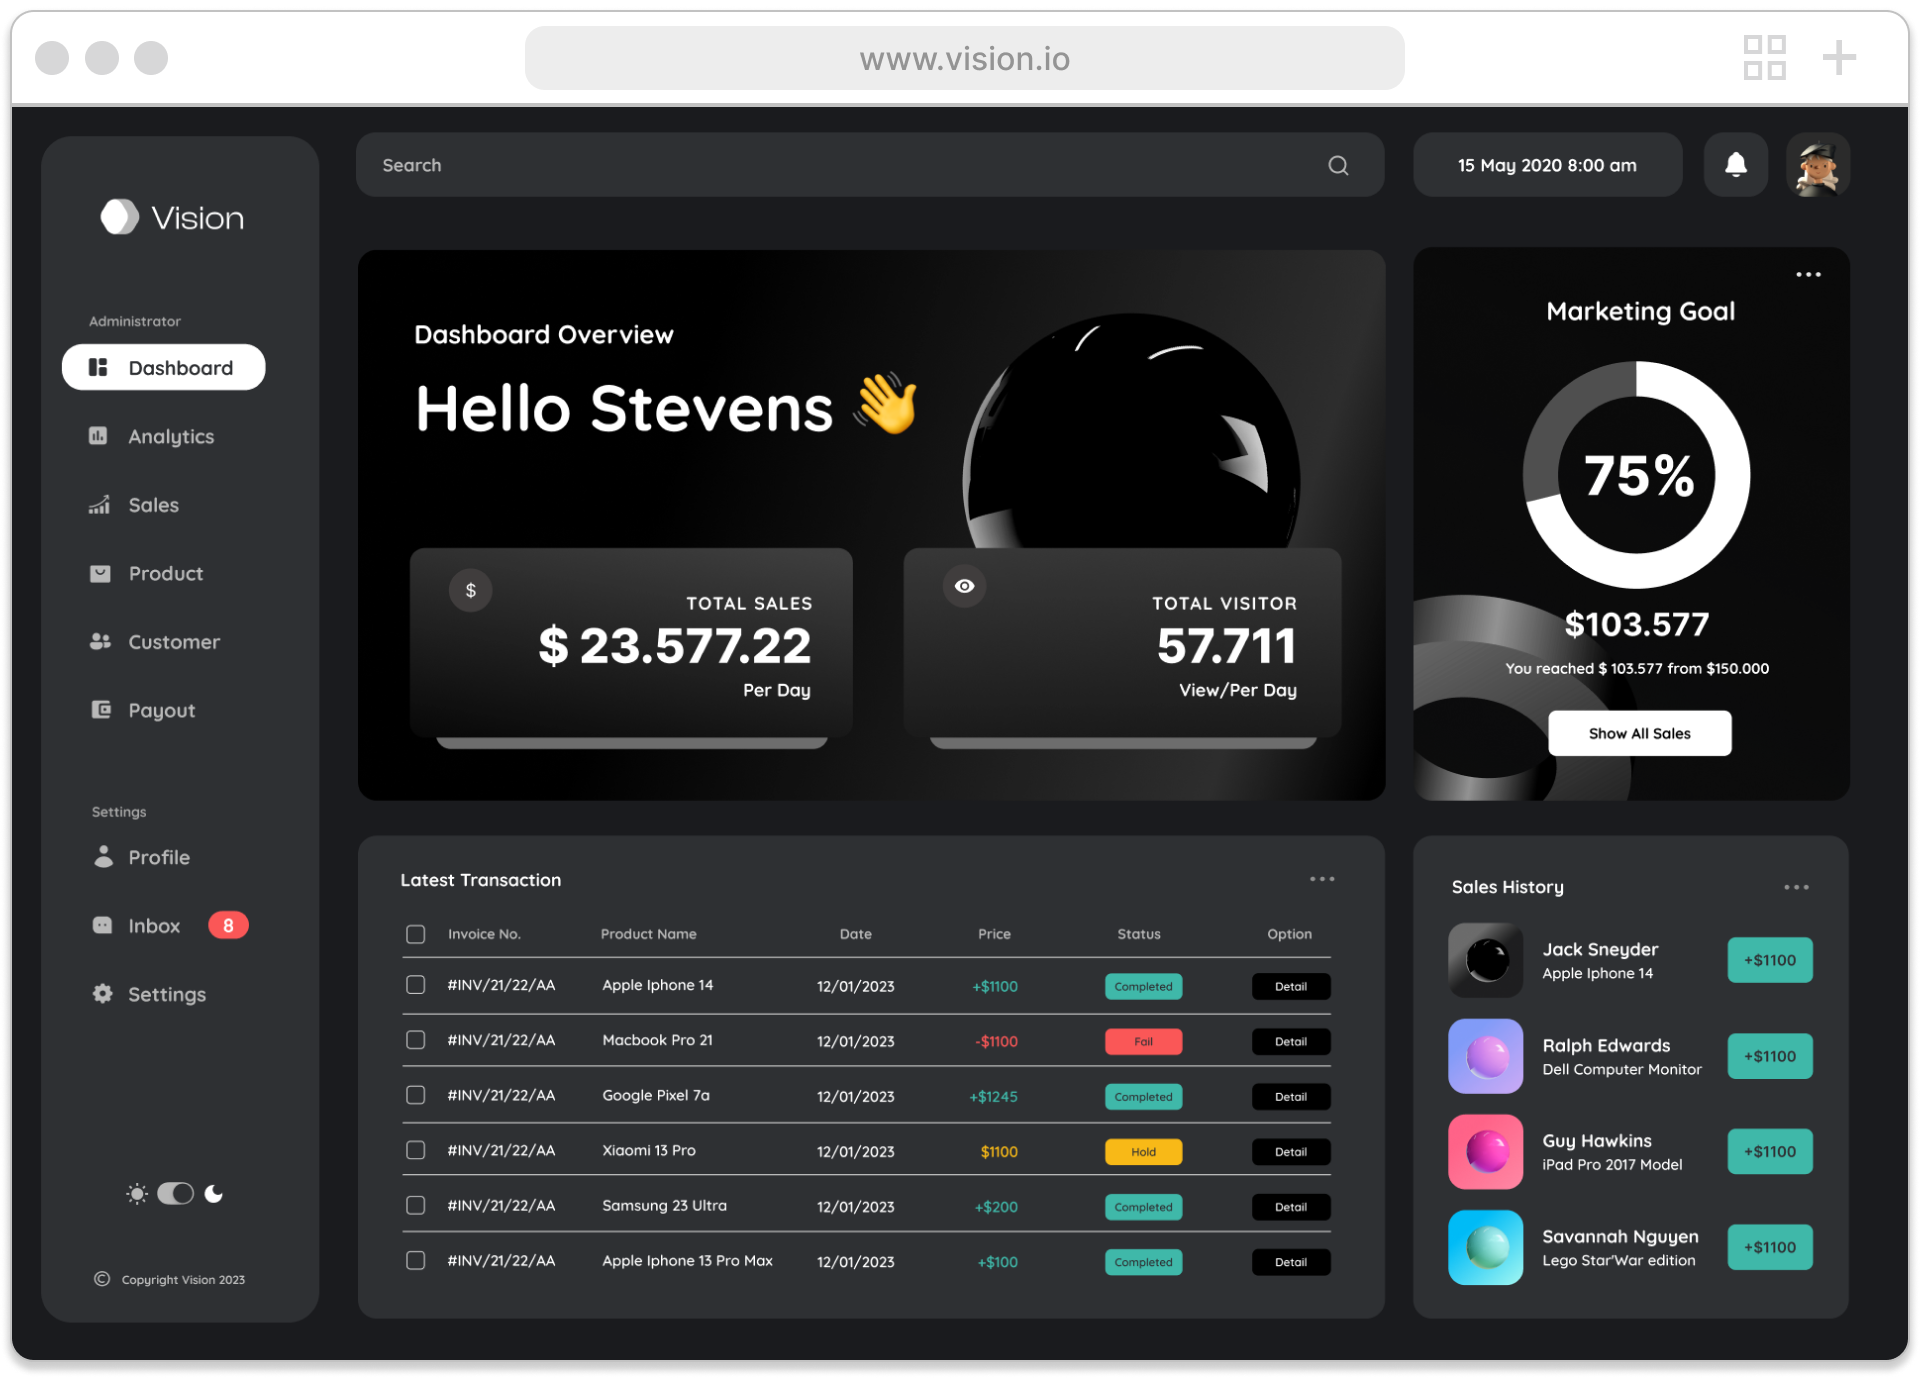
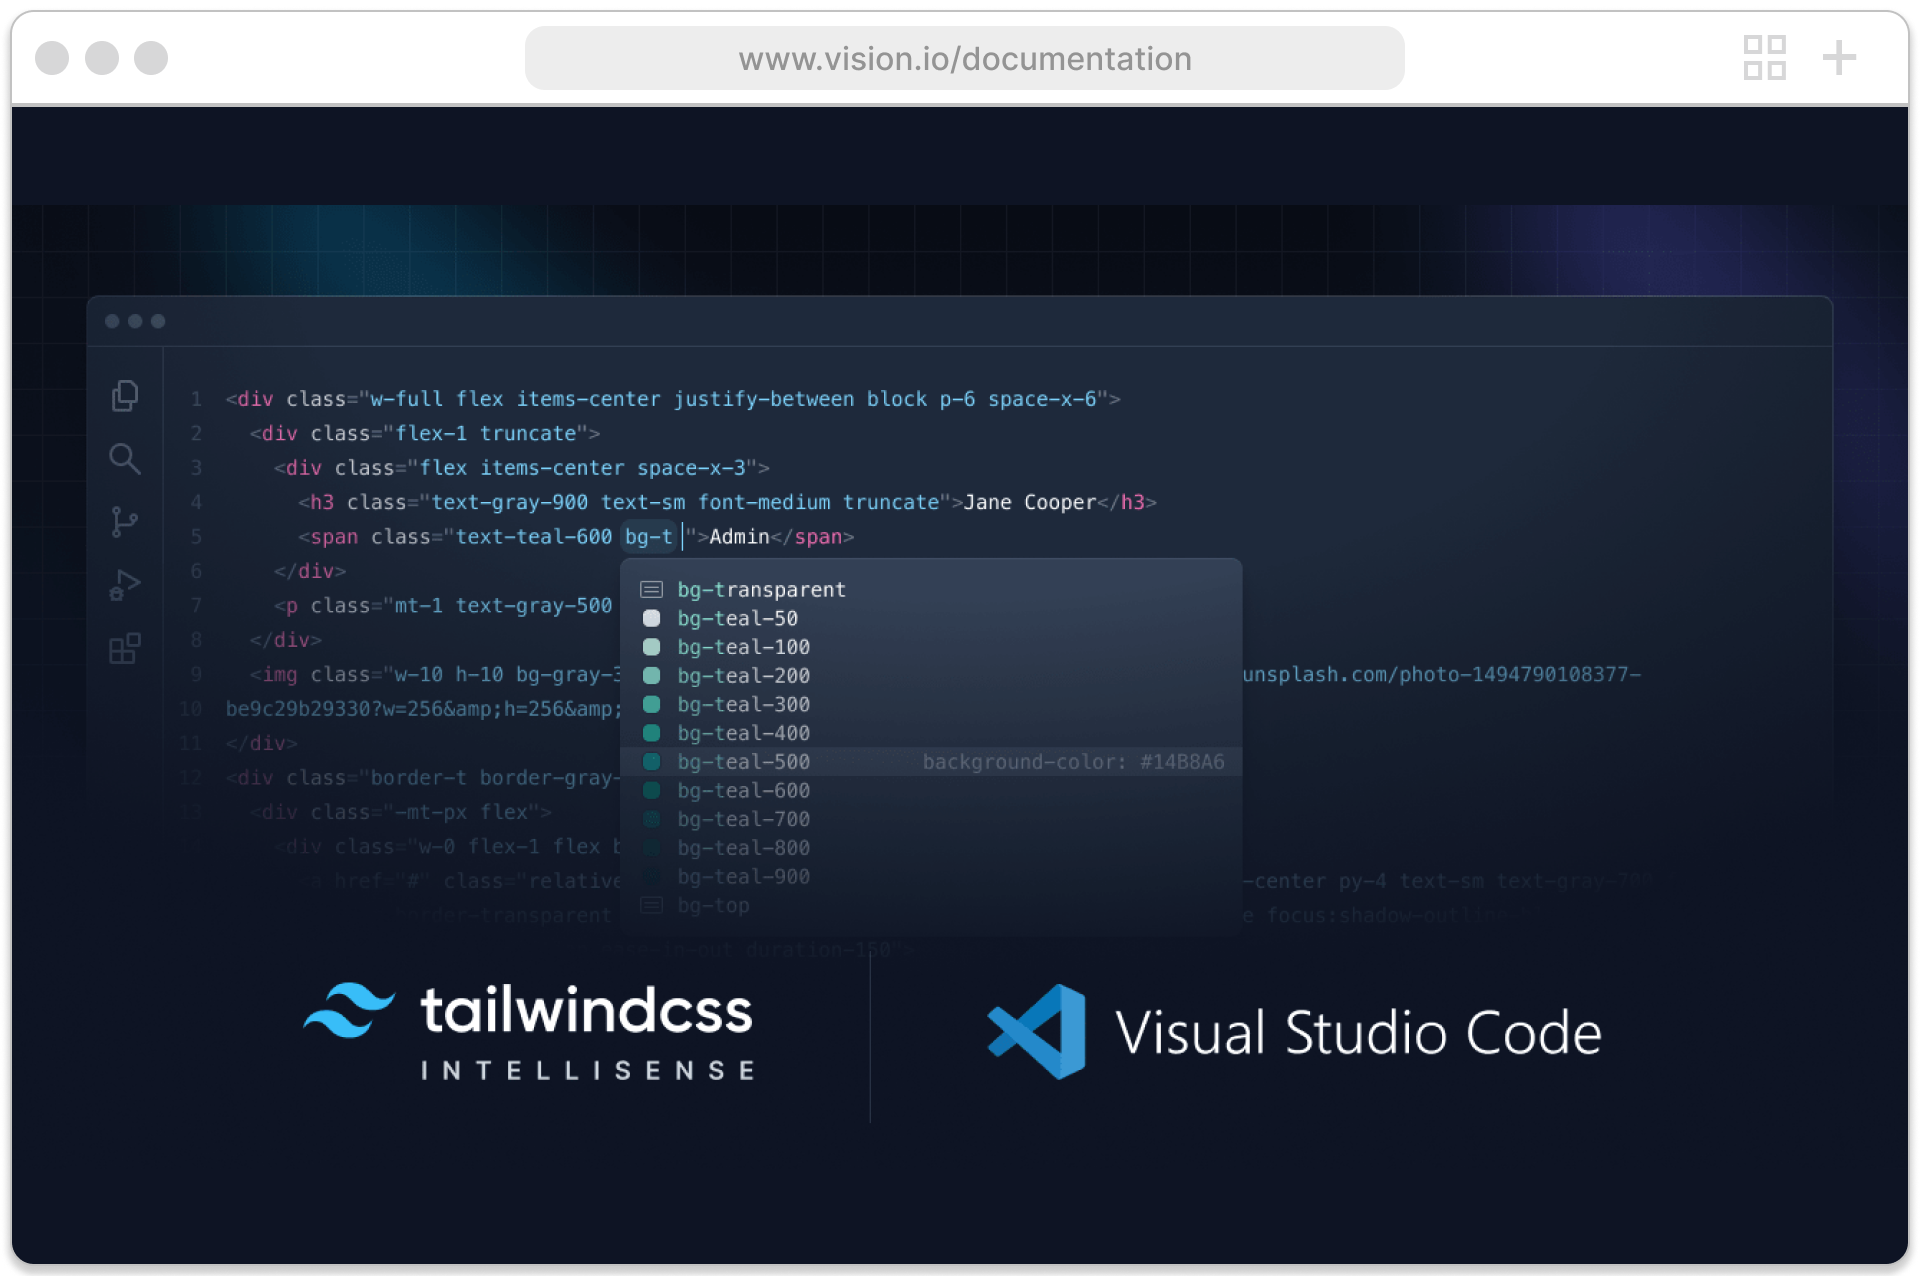
Implementation
The platform was built using Bootstrap 5 with a focus on scalability, performance, and handling complex data interfaces. A modular, component-based system was designed to support consistent data visualization, reusable dashboard patterns, and flexible layouts across different use cases, ensuring a seamless and responsive experience.
Frontend Architecture
The frontend architecture follows a component-driven approach to support scalable dashboard experiences. Reusable components such as data cards, charts, and tables were structured to ensure consistency, reduce development overhead, and enable rapid iteration while maintaining clarity in data presentation.
Reflection
In data-driven products, success is not about how much data you have — but how clearly users can act on it.
This project reinforced that the real value of a marketing dashboard lies in transforming complex data into clear, actionable decisions. Without clarity, even the most powerful analytics become noise.
Effective dashboard design requires:
- Clarity over data density
- Actionable insights over raw metrics
- Guided decision-making over manual analysis
The biggest challenge was reducing complexity without losing critical insights designing a system that helps users focus on what matters and act with confidence.
Other Project
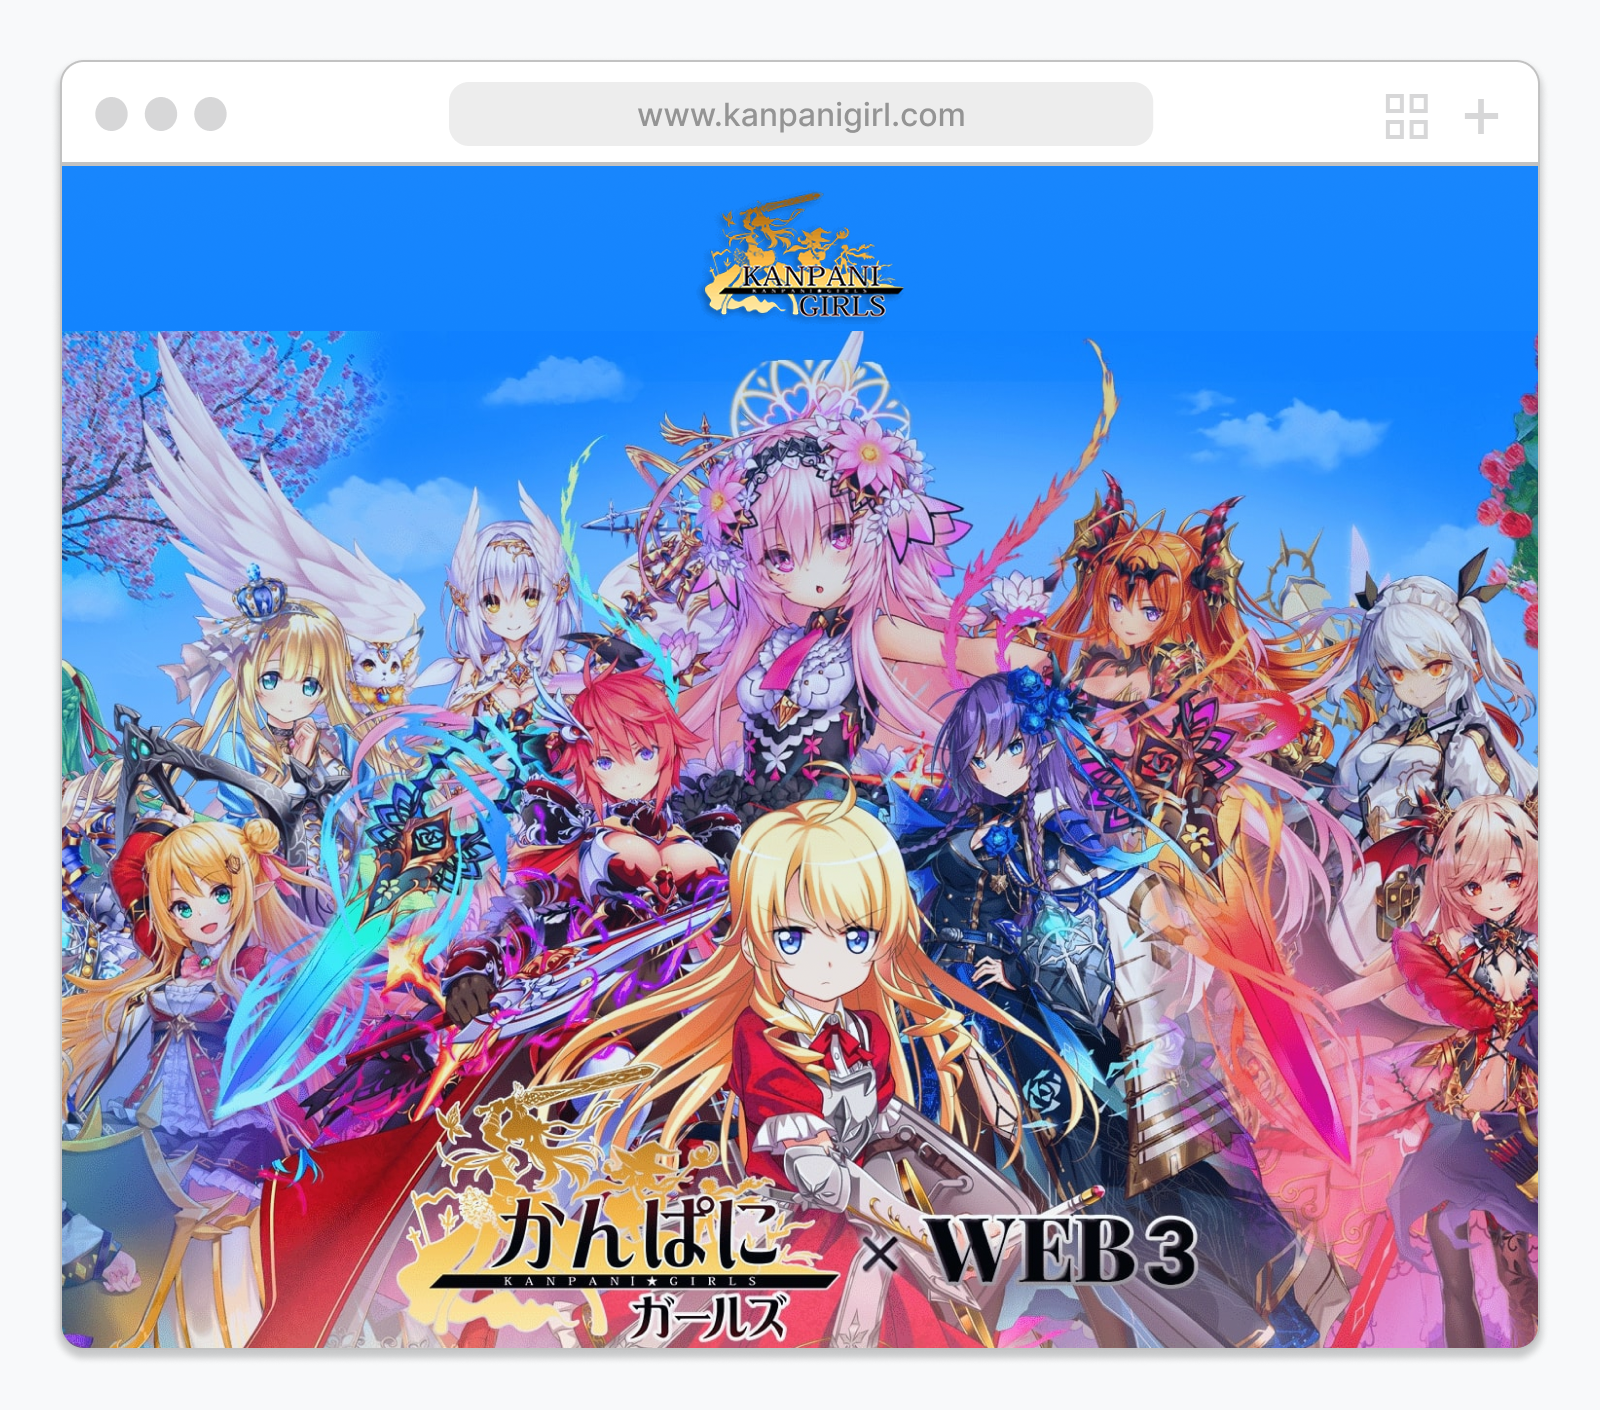
Kanpani Girl
Game Web3 Website
A playful web experience for a Web3 game brand, designed to introduce characters, story, and product moments with strong visual energy.
A unified design system
Healthcare Platform
Digital Maps
App Project Management
A corporate website for GIANTY
an App UI Kit on the subject of stocks
Queezy App UI Kit will help your Quiz
A professional Marketing Dashboard